The global impacts of today’s war in Israel are not the same as 1973


President Biden labeled the Hamas attack on Israel “pure, unadulterated evil.” Footage and reports of the incident left nothing for the imagination in terms of clarity. And the world has received heartrending reports on Israel’s very tough response, and many more will undoubtedly follow.
So far, the current escalation has been most frequently compared with the Yom Kippur War in 1973, partly because Hamas broke through the border fence with Israel almost 50 years to the date after the start of that war, missing the exact anniversary by one day. But in many ways, the analogy goes awry.
During the Yom Kippur War, Egypt and Syria, supported by other Arab states, wanted to reclaim the territories that were lost in the 1967 Six-Day War. On Oct. 6, 1973, on the Jewish holy day of Yom Kippur, Egypt and Syria launched simultaneous surprise attacks on Israeli positions along the Sinai Peninsula and the Golan Heights. During the first days of the war, Israel experienced a very difficult time. However, U.S. support and rapid mobilization — following the initial surprise — were factors contributing to successful counterattacks and a ceasefire was ultimately reached on Oct. 25.
Although the war did not produce a clear military victor, it did make Israel acknowledge that peace with its neighbors was important. And some neighbors realized and accepted that the Jewish state was a fait accompli. Diplomatic rapprochements led to the 1978 Camp David Accords between Israel and Egypt, for example, with the recognition of Israel by Egypt and Israel’s withdrawal from Sinai.
The war had major economic consequences. In response to U.S. support for Israel, oil-exporting Arab countries announced an oil embargo against the U.S. and other Western countries. This led to a sharp increase in crude prices and triggered an energy crisis in the West.
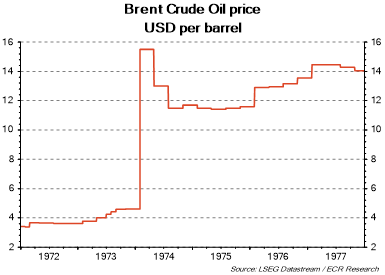
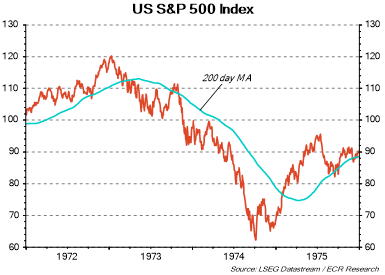
Equity markets reacted very negatively to oil price increases and uncertainty. The S&P 500 index plunged over 10 percent in the month after the war broke out. It would then fall much further partly due to the oil embargo declared on Oct. 19; the index lost over 40 percent in just under a year from October 1973 to its low in September 1974.
Many analysts have warned that the geopolitical and economic consequences of the Hamas attack and its aftermath might be compared to those of the Yom Kippur War. But this comparison is flawed in many respects:
- In 1973, several Arab countries declared war on Israel. This time, however, it concerns an attack by an armed group, supported by several other militant movements. At this point, countries such as Saudi Arabia, Egypt and Jordan are more or less watching from the sidelines.
- A very sharp increase in oil demand was evident at the time. In the 1970s, car sales experienced strong growth, especially in the U.S. This resulted in an increase in fuel consumption and a greater dependence on oil. In any case, countries such as the U.S. and many European states had become highly industrialized countries with an established high and increasing demand for oil. Emerging markets such as South Korea and Taiwan began to industrialize heavily during this period, which massively boosted their oil demand. Furthermore, the Soviet Union and Eastern Europe faced a rapid increase in energy needs for their industrial and military activities. In a broader context, compared to subsequent decades, the global population grew relatively rapidly from the end of the Second World War until the 1980s, with the fastest growth occurring mainly in the 1960s and early 1970s. Apart from the revival in oil demand following the COVID-19 crisis, it cannot be said that demand is rising very rapidly at this point. This is partly due to the energy transition — including an increasingly large share of electric vehicles in car sales — and flattening global population growth.
- In the 1970s, oil producers were operating at more or less full capacity when the oil embargo was announced, which is why there was a considerable lack of spare capacity. U.S. producers in particular were operating at maximum capacity at the time and their oil fields were becoming depleted. This enabled OPEC to strike hard. At any rate, Saudi Arabia and the United Arab Emirates currently still have (a great deal of) scope to step up production; according to some experts, OPEC+ had a spare capacity of around 4 million barrels a day in July. Countries such as the US, Canada and Brazil could also increase their production.
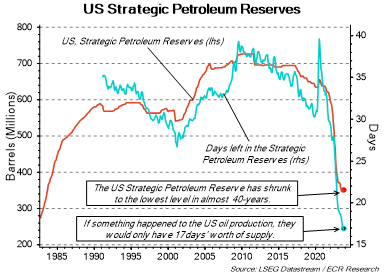
- The U.S. has strategic oil reserves nowadays, which it started amassing in 1975 in response to the oil crisis. The U.S. has taken vast amounts from these reserves following the COVID-19 crisis and they have declined significantly — under President Biden, 180 million barrels have been taken from the reserves since March 2022. Nevertheless, it still holds over 350 million barrels.
- The oil supplier market is far more varied than in the 1970s, as is the total energy market. Countries outside OPEC have become (more) important players — including the U.S., Canada and Brazil – and the shift to alternative energy sources and renewable energy is steadily underway. In 1973, oil accounted for 48.5 percent of total global energy consumption; by 2019, this share had declined to 40.4 percent, which is still impressive. In short, compared to the 1970s, the current global oil market is characterized by a wider range of producers and heightened competition from other energy sources.
- The oil crisis prompted oil-importing countries to join forces as part of the International Energy Agency (IEA) in 1974. The IEA was intended to increase energy certainty and reduce the dependence of industrialized countries on oil-exporting countries. The aim was to set up mechanisms to address oil supply shortages and ensure that sufficient oil was available to member states in the event of a new crisis. More specifically, the IEA contributed and still contributes to the creation of strategic reserves and the coordination of measures to address oil supply shortages. In addition, it encourages improvements in energy efficiency, cooperation among members, diversification of energy sources and renewable energy use. The agency regularly organizes emergency exercises in which member states jointly respond to simulated energy crises. During the 1973 oil crisis, the IEA did not yet exist and the response to towering oil prices was, therefore, far more chaotic and ill-considered than it would probably be now. This is partly due to the IEA’s policies.
- In 1973, per one estimate, the OPEC countries unilaterally increased the oil price by 70 percent (even before the oil embargo). Saudi Arabia and other members of OPEC+ have absolutely no need for this now. Indeed, if they did this, they would kill the goose that lays the golden eggs by plunging the global economy into recession and accelerating the energy transition. Perhaps the OPEC+ countries would like to see the oil price just above $100, but it must certainly not increase further.
This shows that we have to be very careful in drawing comparisons with previous instances of escalation of the Israeli-Palestinian conflict and basing forecasts of the economic and geopolitical consequences of today’s war on what happened before.
Andy Langenkamp is a senior political analyst at ECR Research, which offers independent research on asset allocation, global financial markets, politics and FX, and interest rates.
Copyright 2023 Nexstar Media Inc. All rights reserved. This material may not be published, broadcast, rewritten, or redistributed. Regular the hill posts


The Hill Podcasts